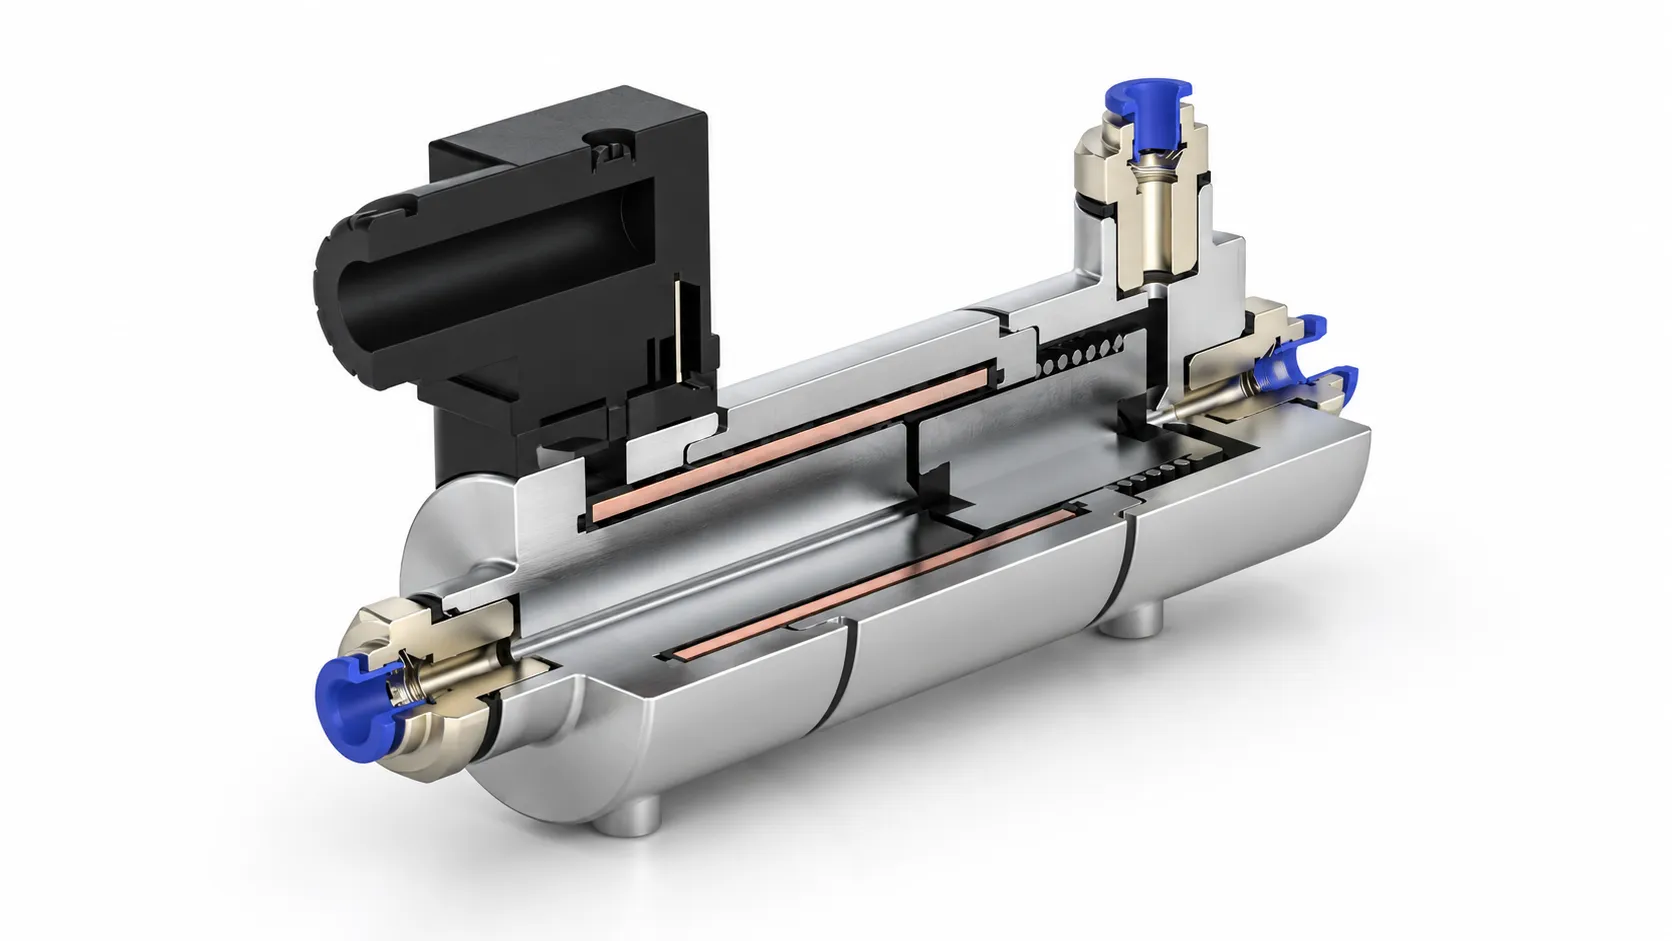
Electromagnetic Pneumatic Valve
The first draft was too weak and ran too hot.
Actuator design, Munich University of Applied Sciences, Winter 2025/26 · 3 months
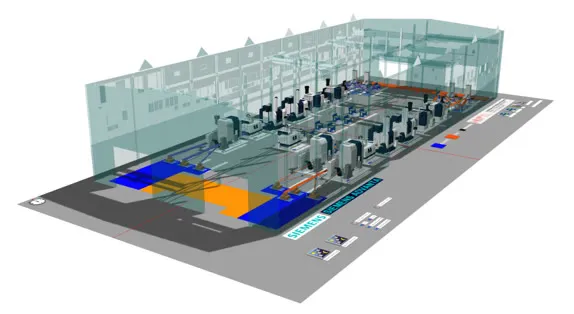
Stations from a class library — Source, SingleProc, Buffer, Assembly, Drain — dragged onto a network and chained with connectors, each one given a processing time, a failure rate and a control script. This is that model: GearboxA and GearboxB running side by side from turning through final assembly.
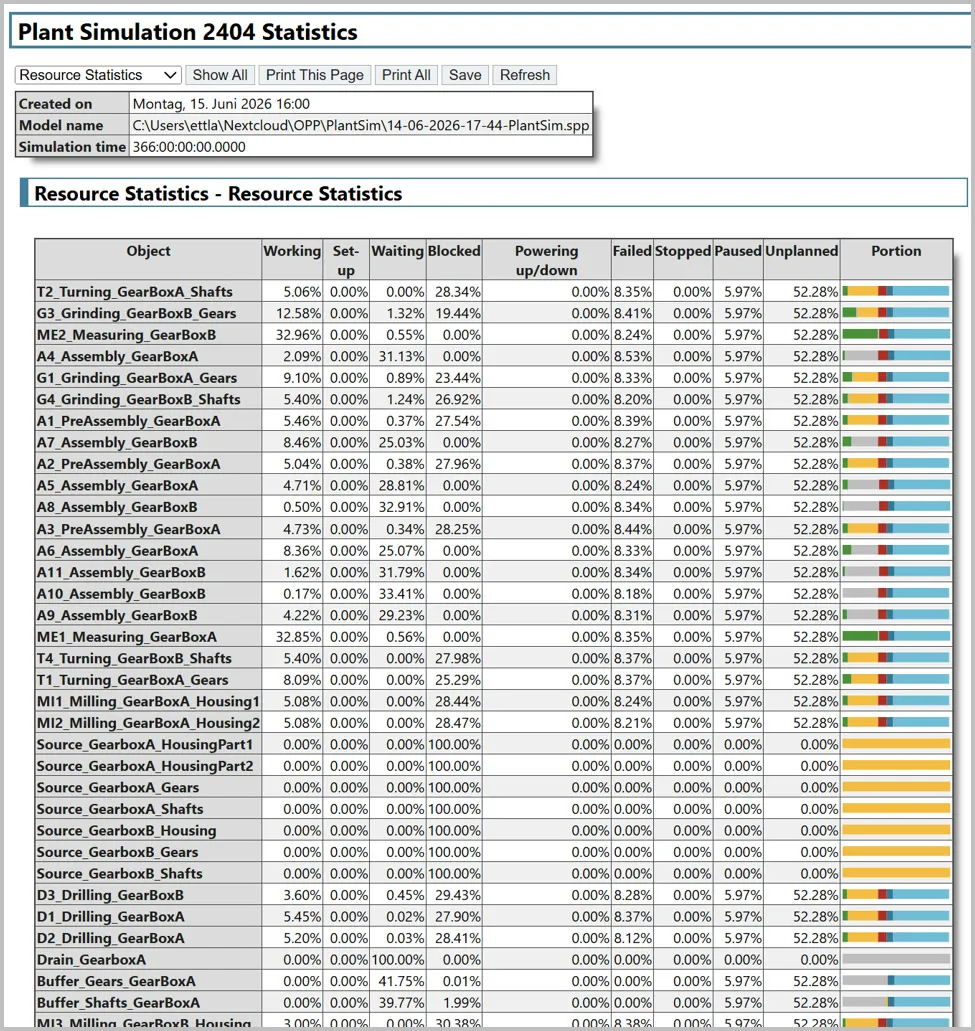
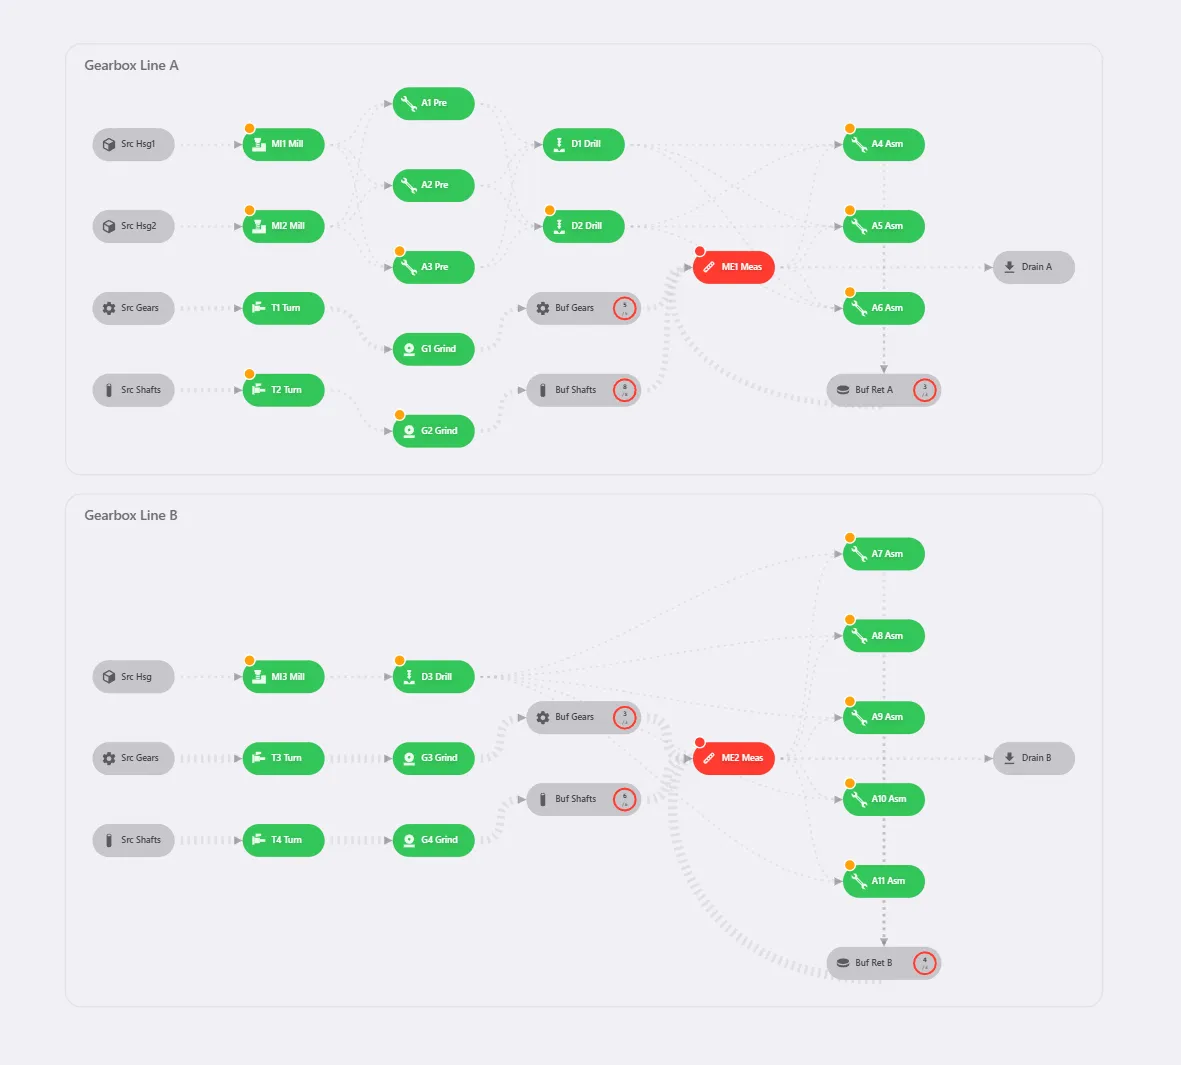
Plant Simulation answers with hundreds of rows of station statistics, readable alone but not something two people can discuss in front of one screen. What replaces them is a single HTML file, about 4,600 lines, with no external dependencies. Out of that report's flat table, the tool draws a map instead: DOMParser reads each row, D3 lays Line A and Line B out as a flow diagram, with utilisation, buffer fill and the bottleneck flag embedded straight into the same nodes rather than a separate column.
Bottleneck means over 75% utilisation with under 5% waiting; ME1 sits at 78.7%, the rate-limiting step for the whole of Line A. Click Fix and the view zooms straight to that node; hover it and every station it feeds lights up, with the panel underneath spelling out the problem and the fix — duplicate ME1, reconnect the feeders, and Line A's modelled throughput climbs 20 to 35%. Confidence intervals ride along with every number, and work in progress comes from Little's Law, so gearbox variants with different part counts stay comparable.
A short walkthrough of the tool's best features, cut silent for a quick look.
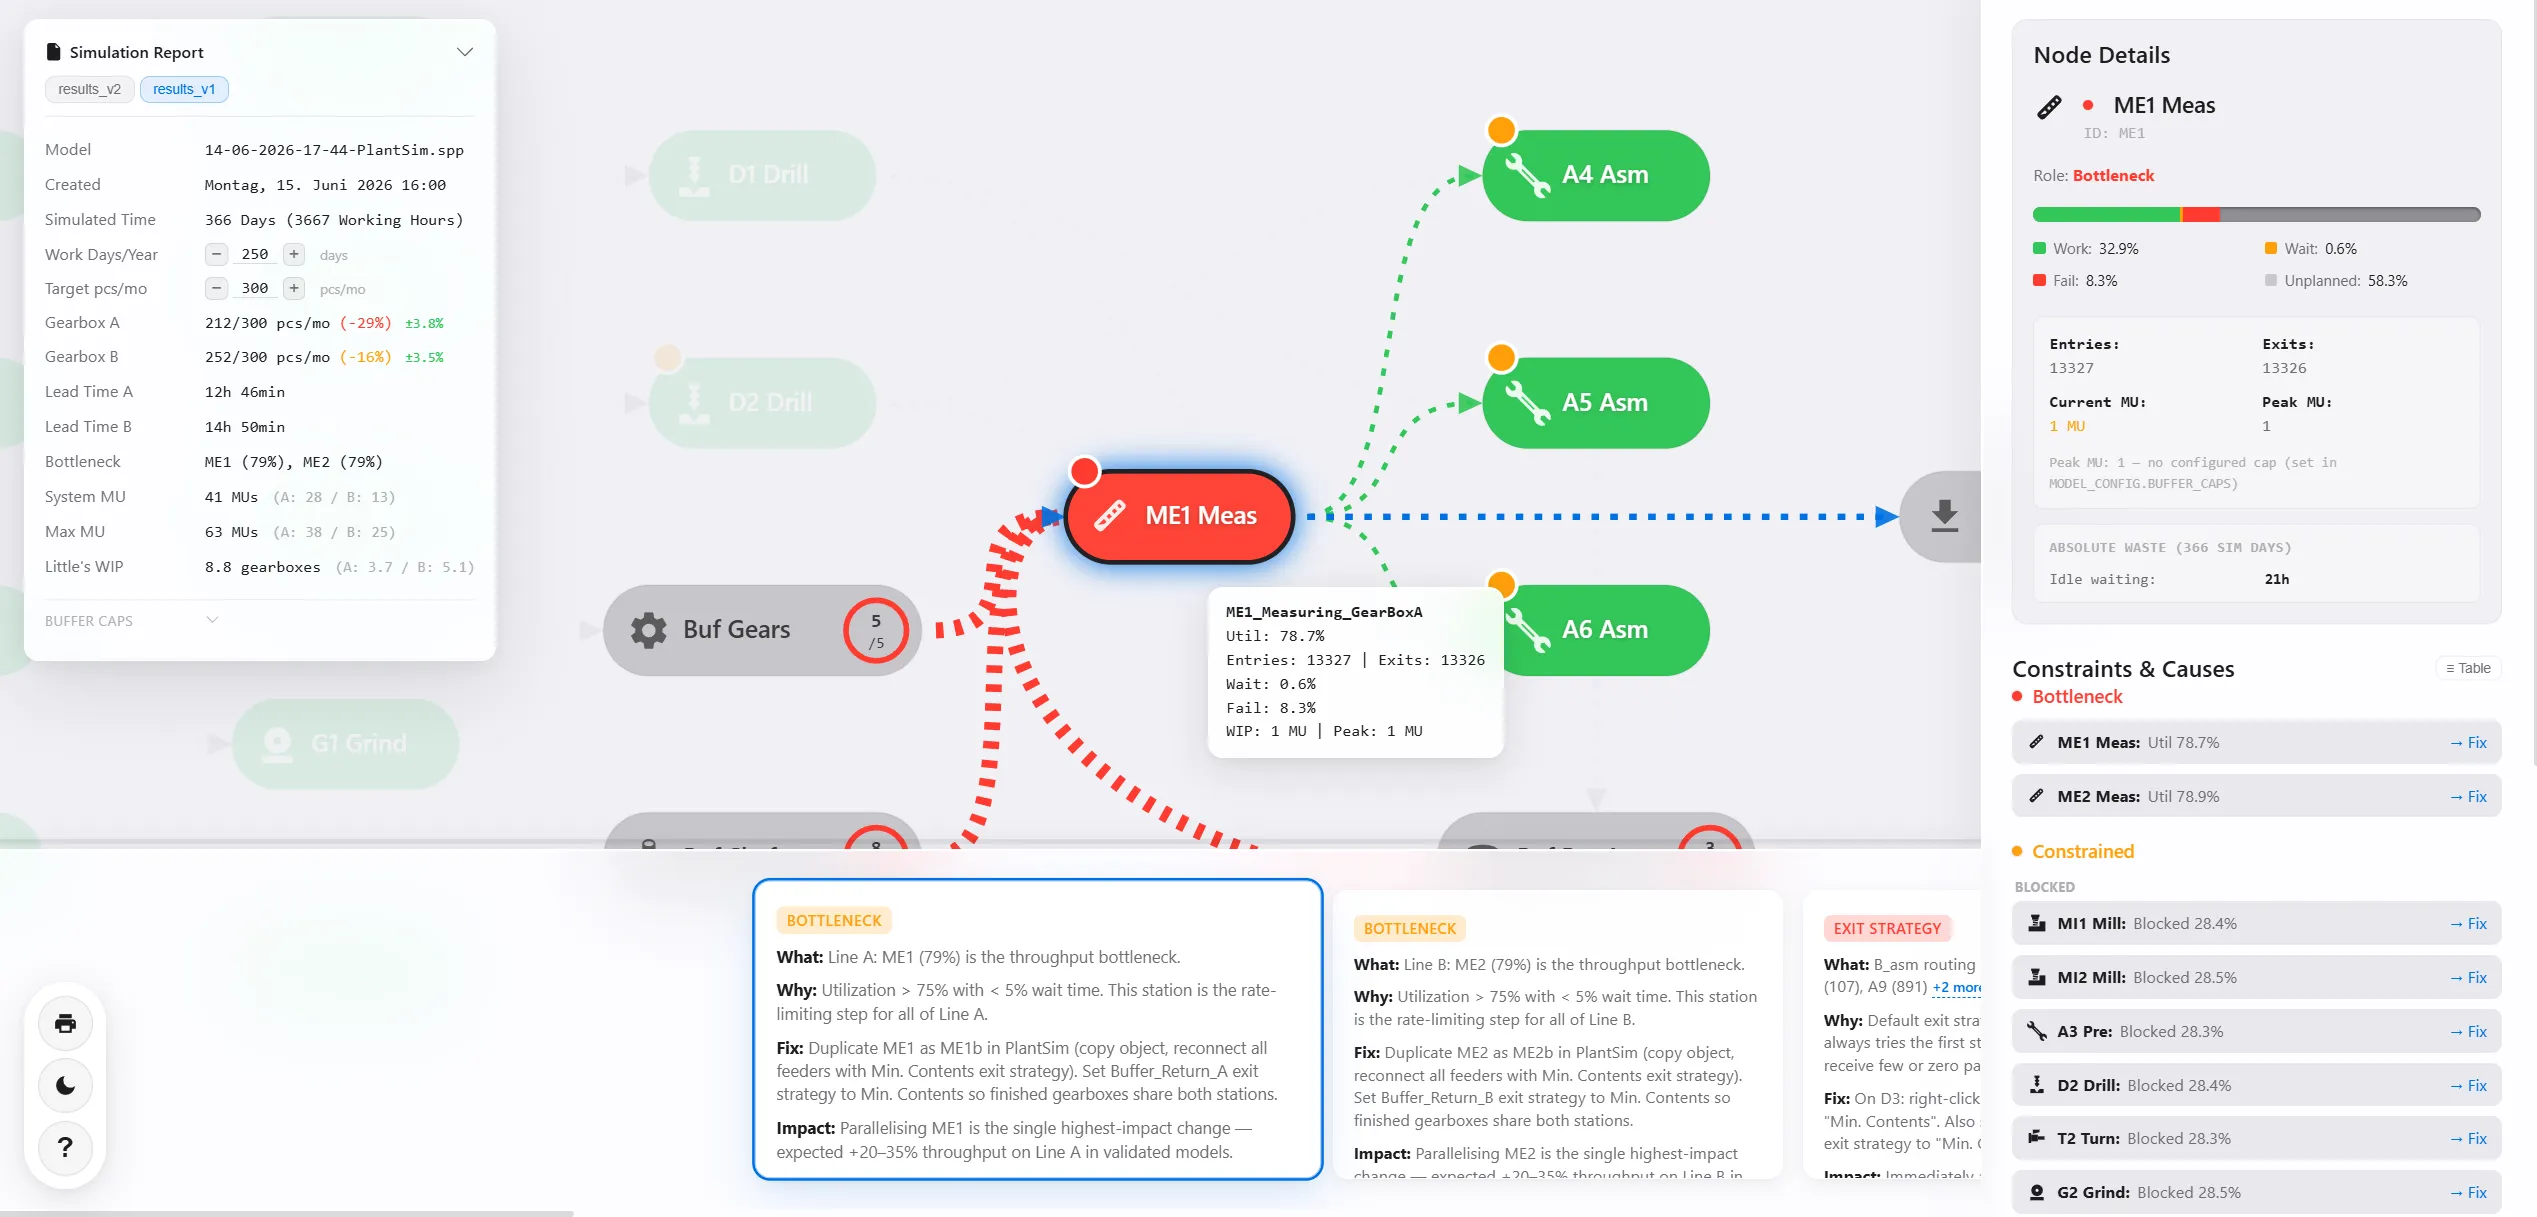
The tool runs right here in the browser, loaded with a real report from my gearbox model. Click nodes, zoom, hit «Fix» in the constraints panel. Drop your own Plant Simulation export on top to replace it.
The Gearbox Visualizer needs more room to operate than a phone gives it. Available on a tablet or larger.
The first draft was too weak and ran too hot.
Actuator design, Munich University of Applied Sciences, Winter 2025/26 · 3 months
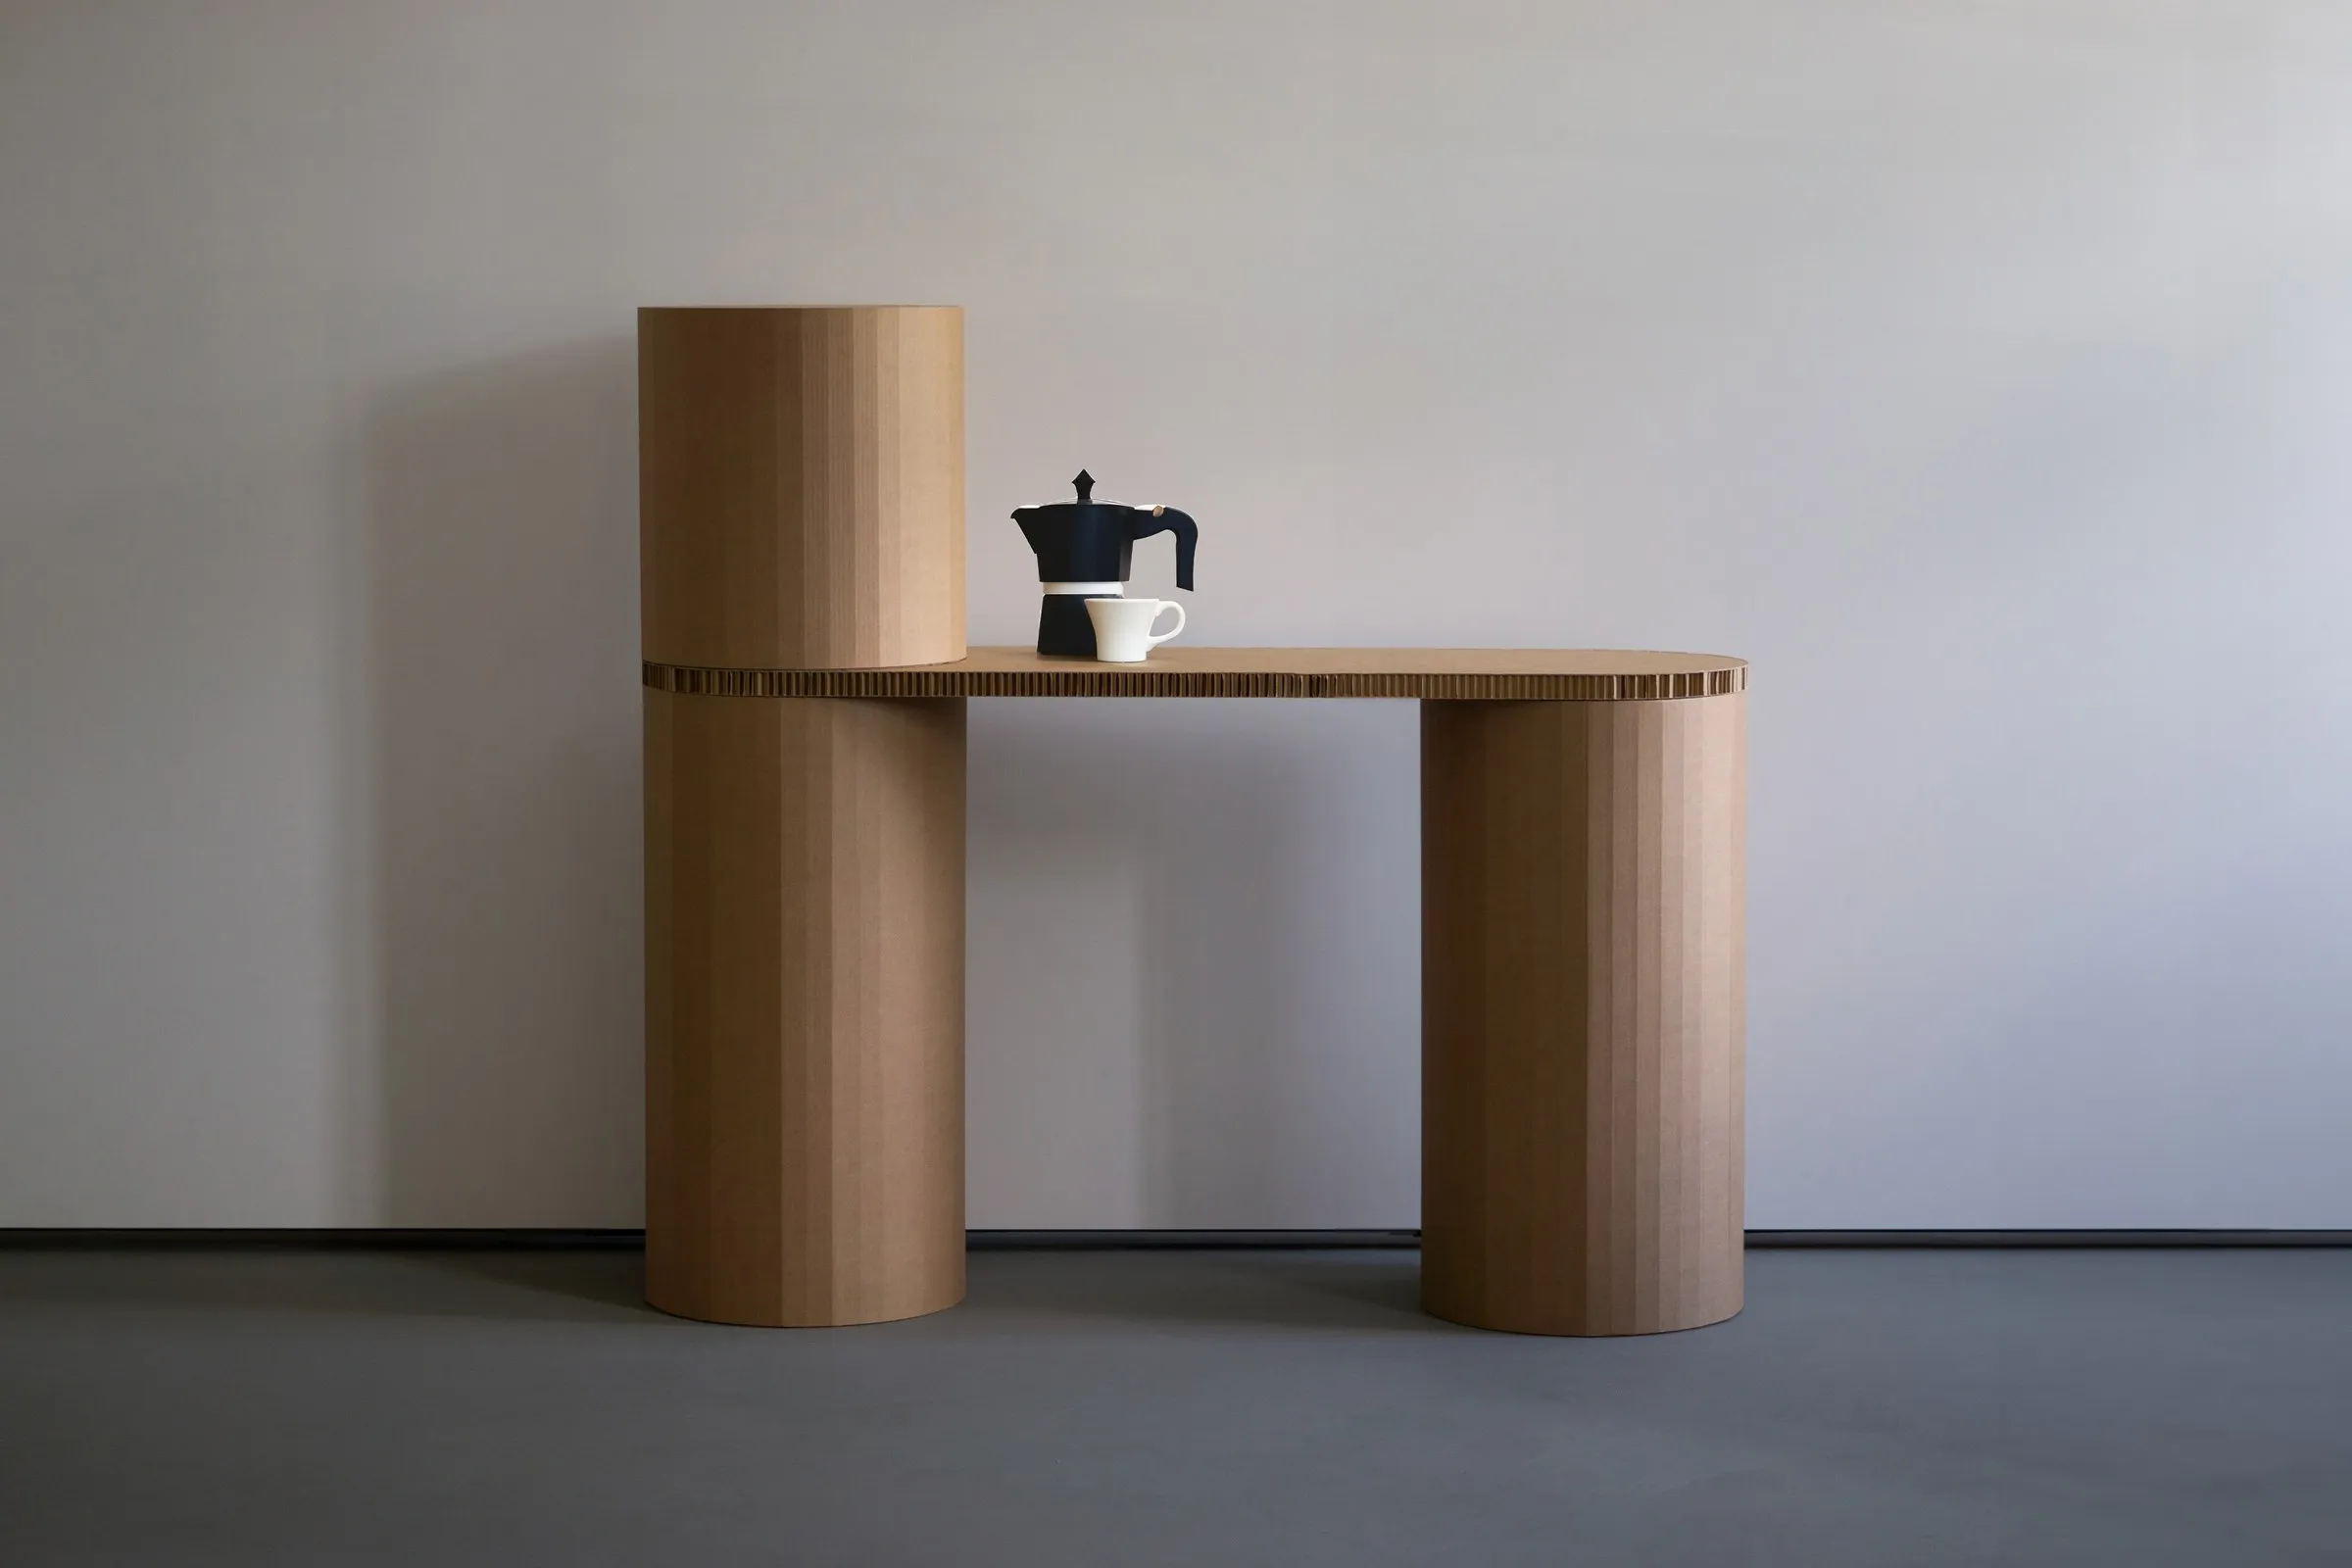
A trade fair stand lives for three days.
Semester project with a packaging manufacturer, Summer 2023 · 3 months
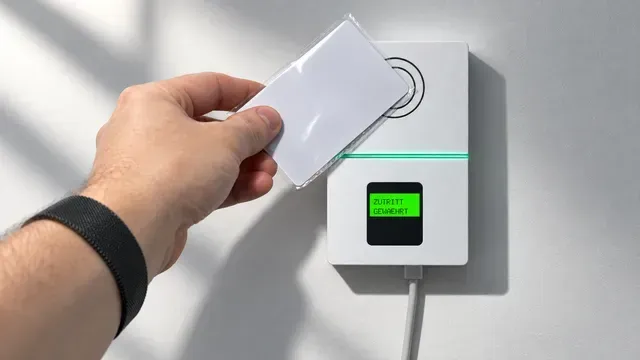
The interesting part starts when the network drops.
Data communication, Munich University of Applied Sciences, Winter 2025/26 · 3 months
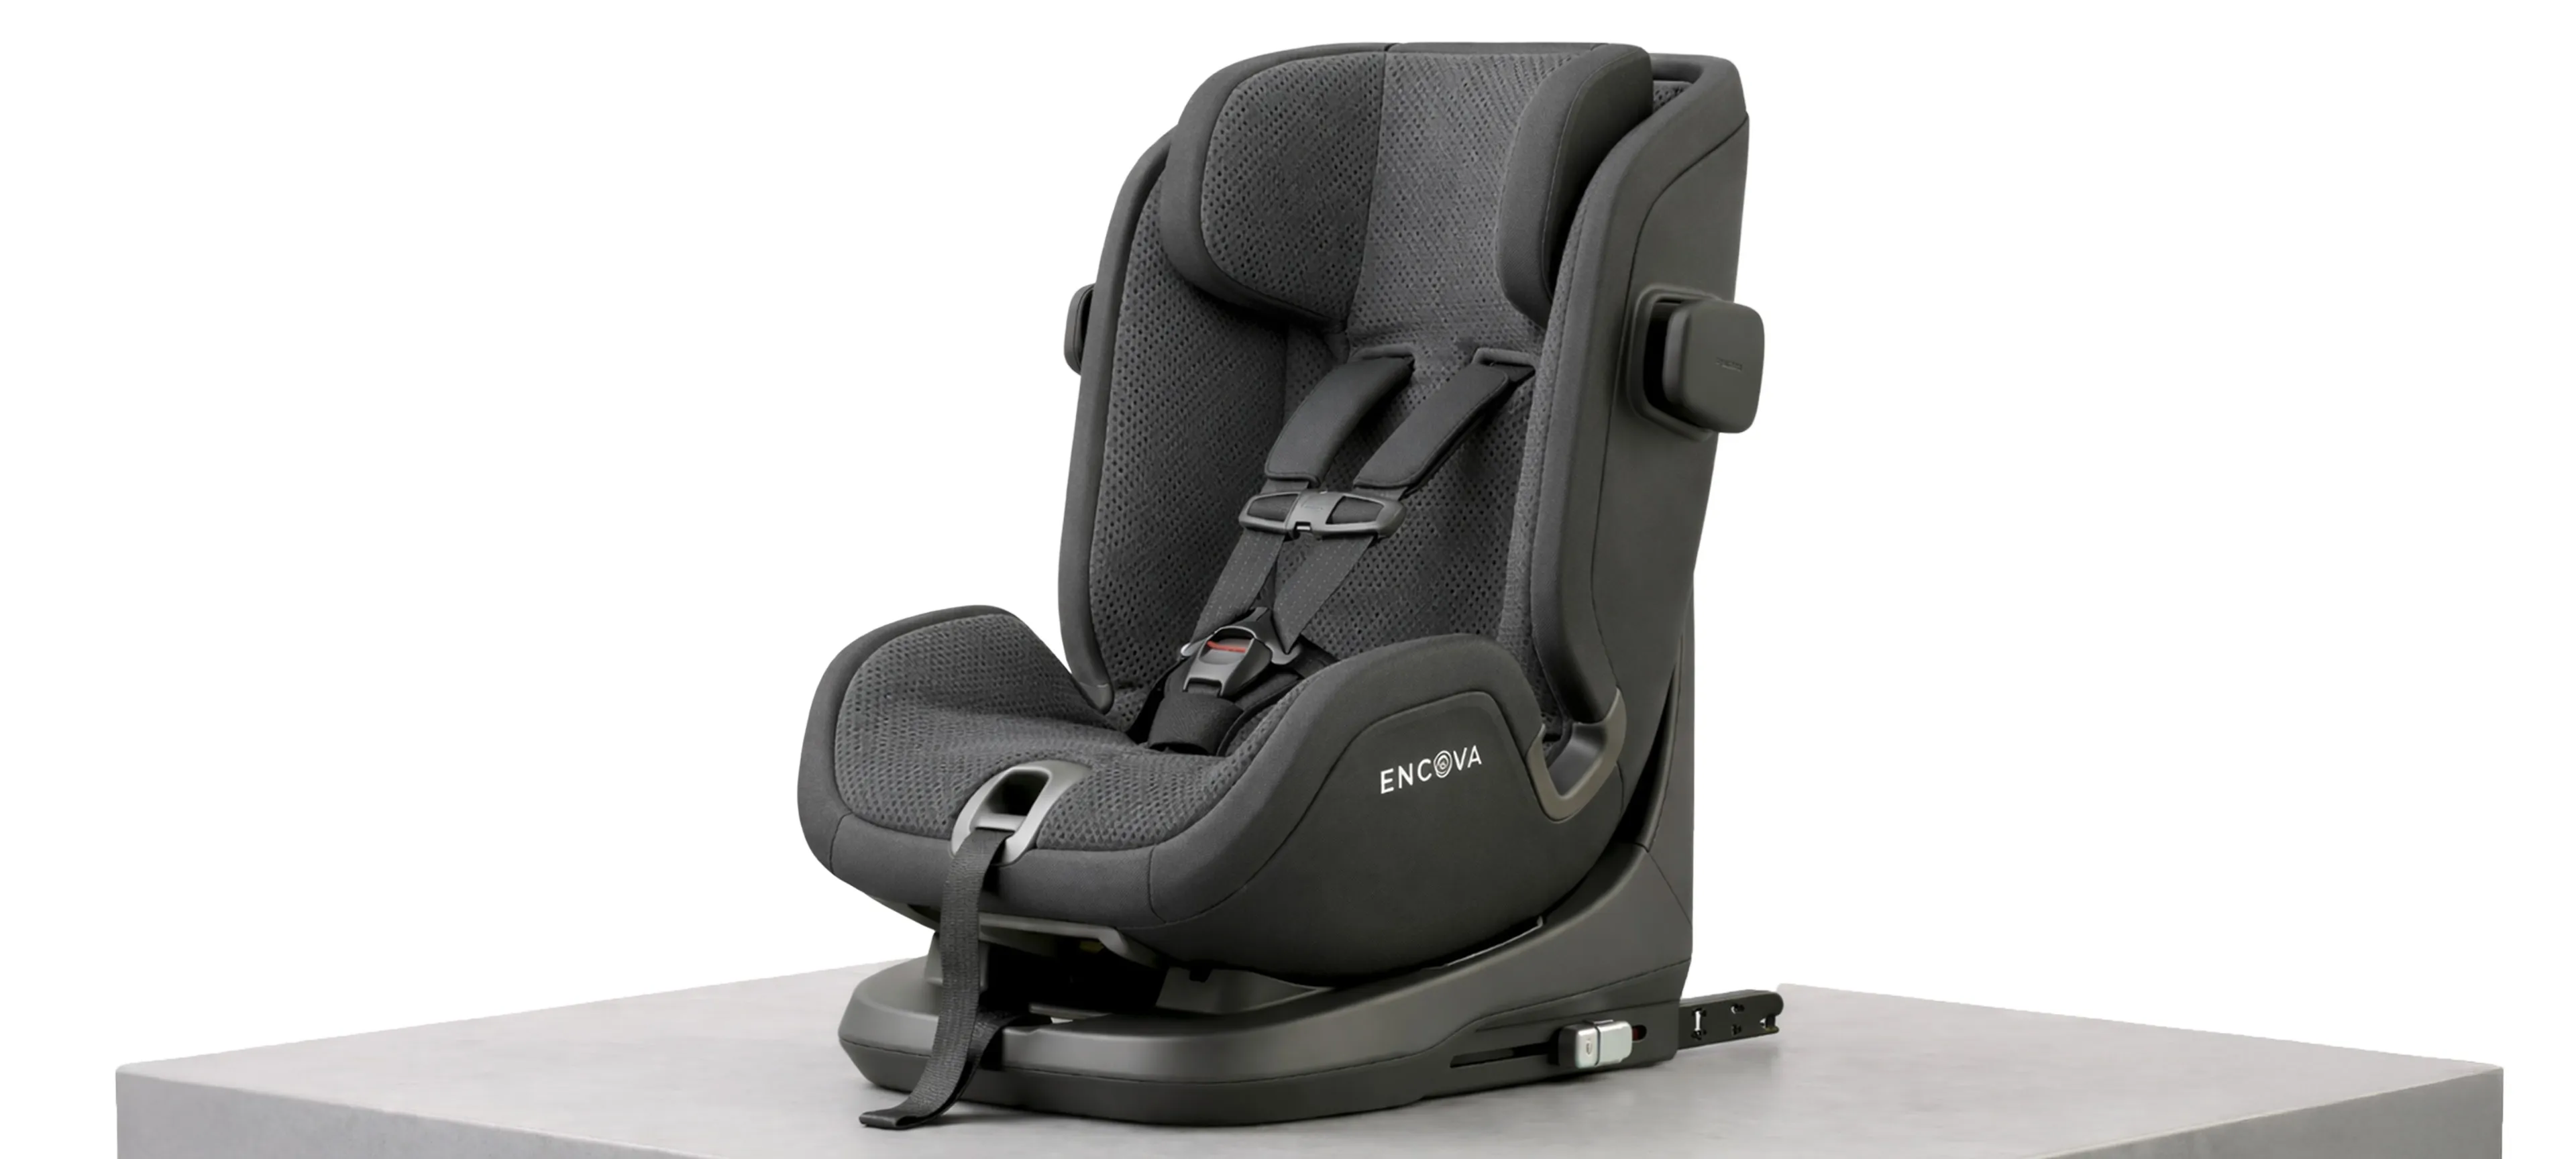
Friday morning, an open brief. Sunday at nine, hand-in.
VDI student competition “Mobility goes Additive”, Friedrichshafen, 17–19 April 2026 · 3 days
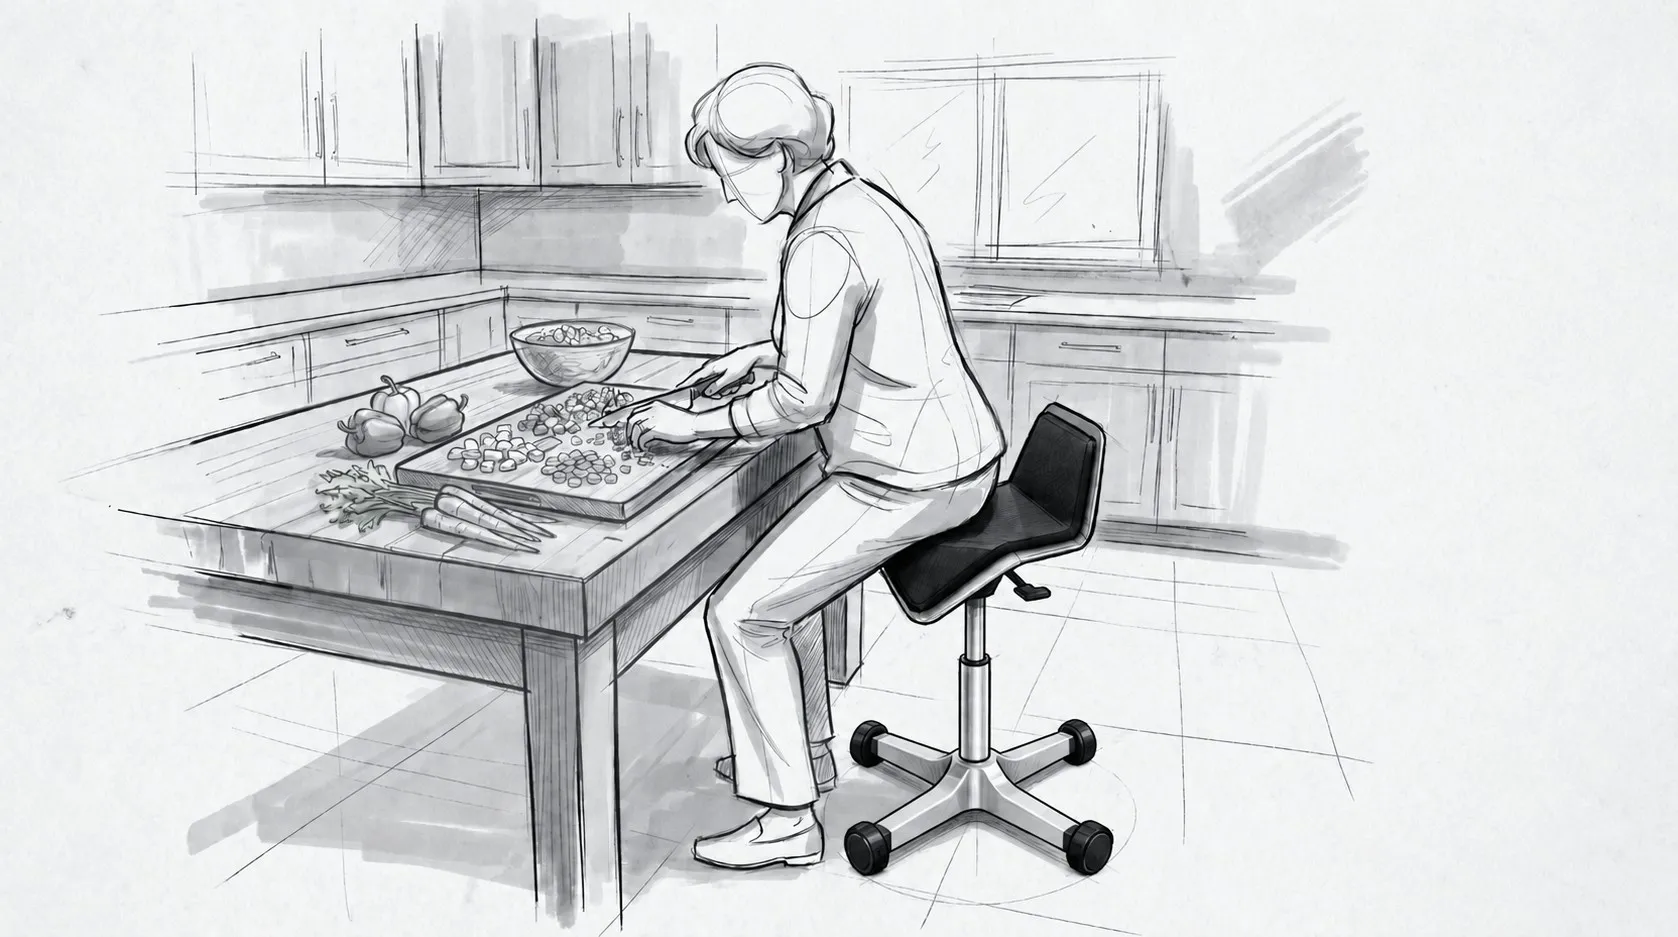
Two real quotes for the same part, more than double apart.
Mechatronic Product Development, Munich University of Applied Sciences, Winter 2025/26 · 3 months
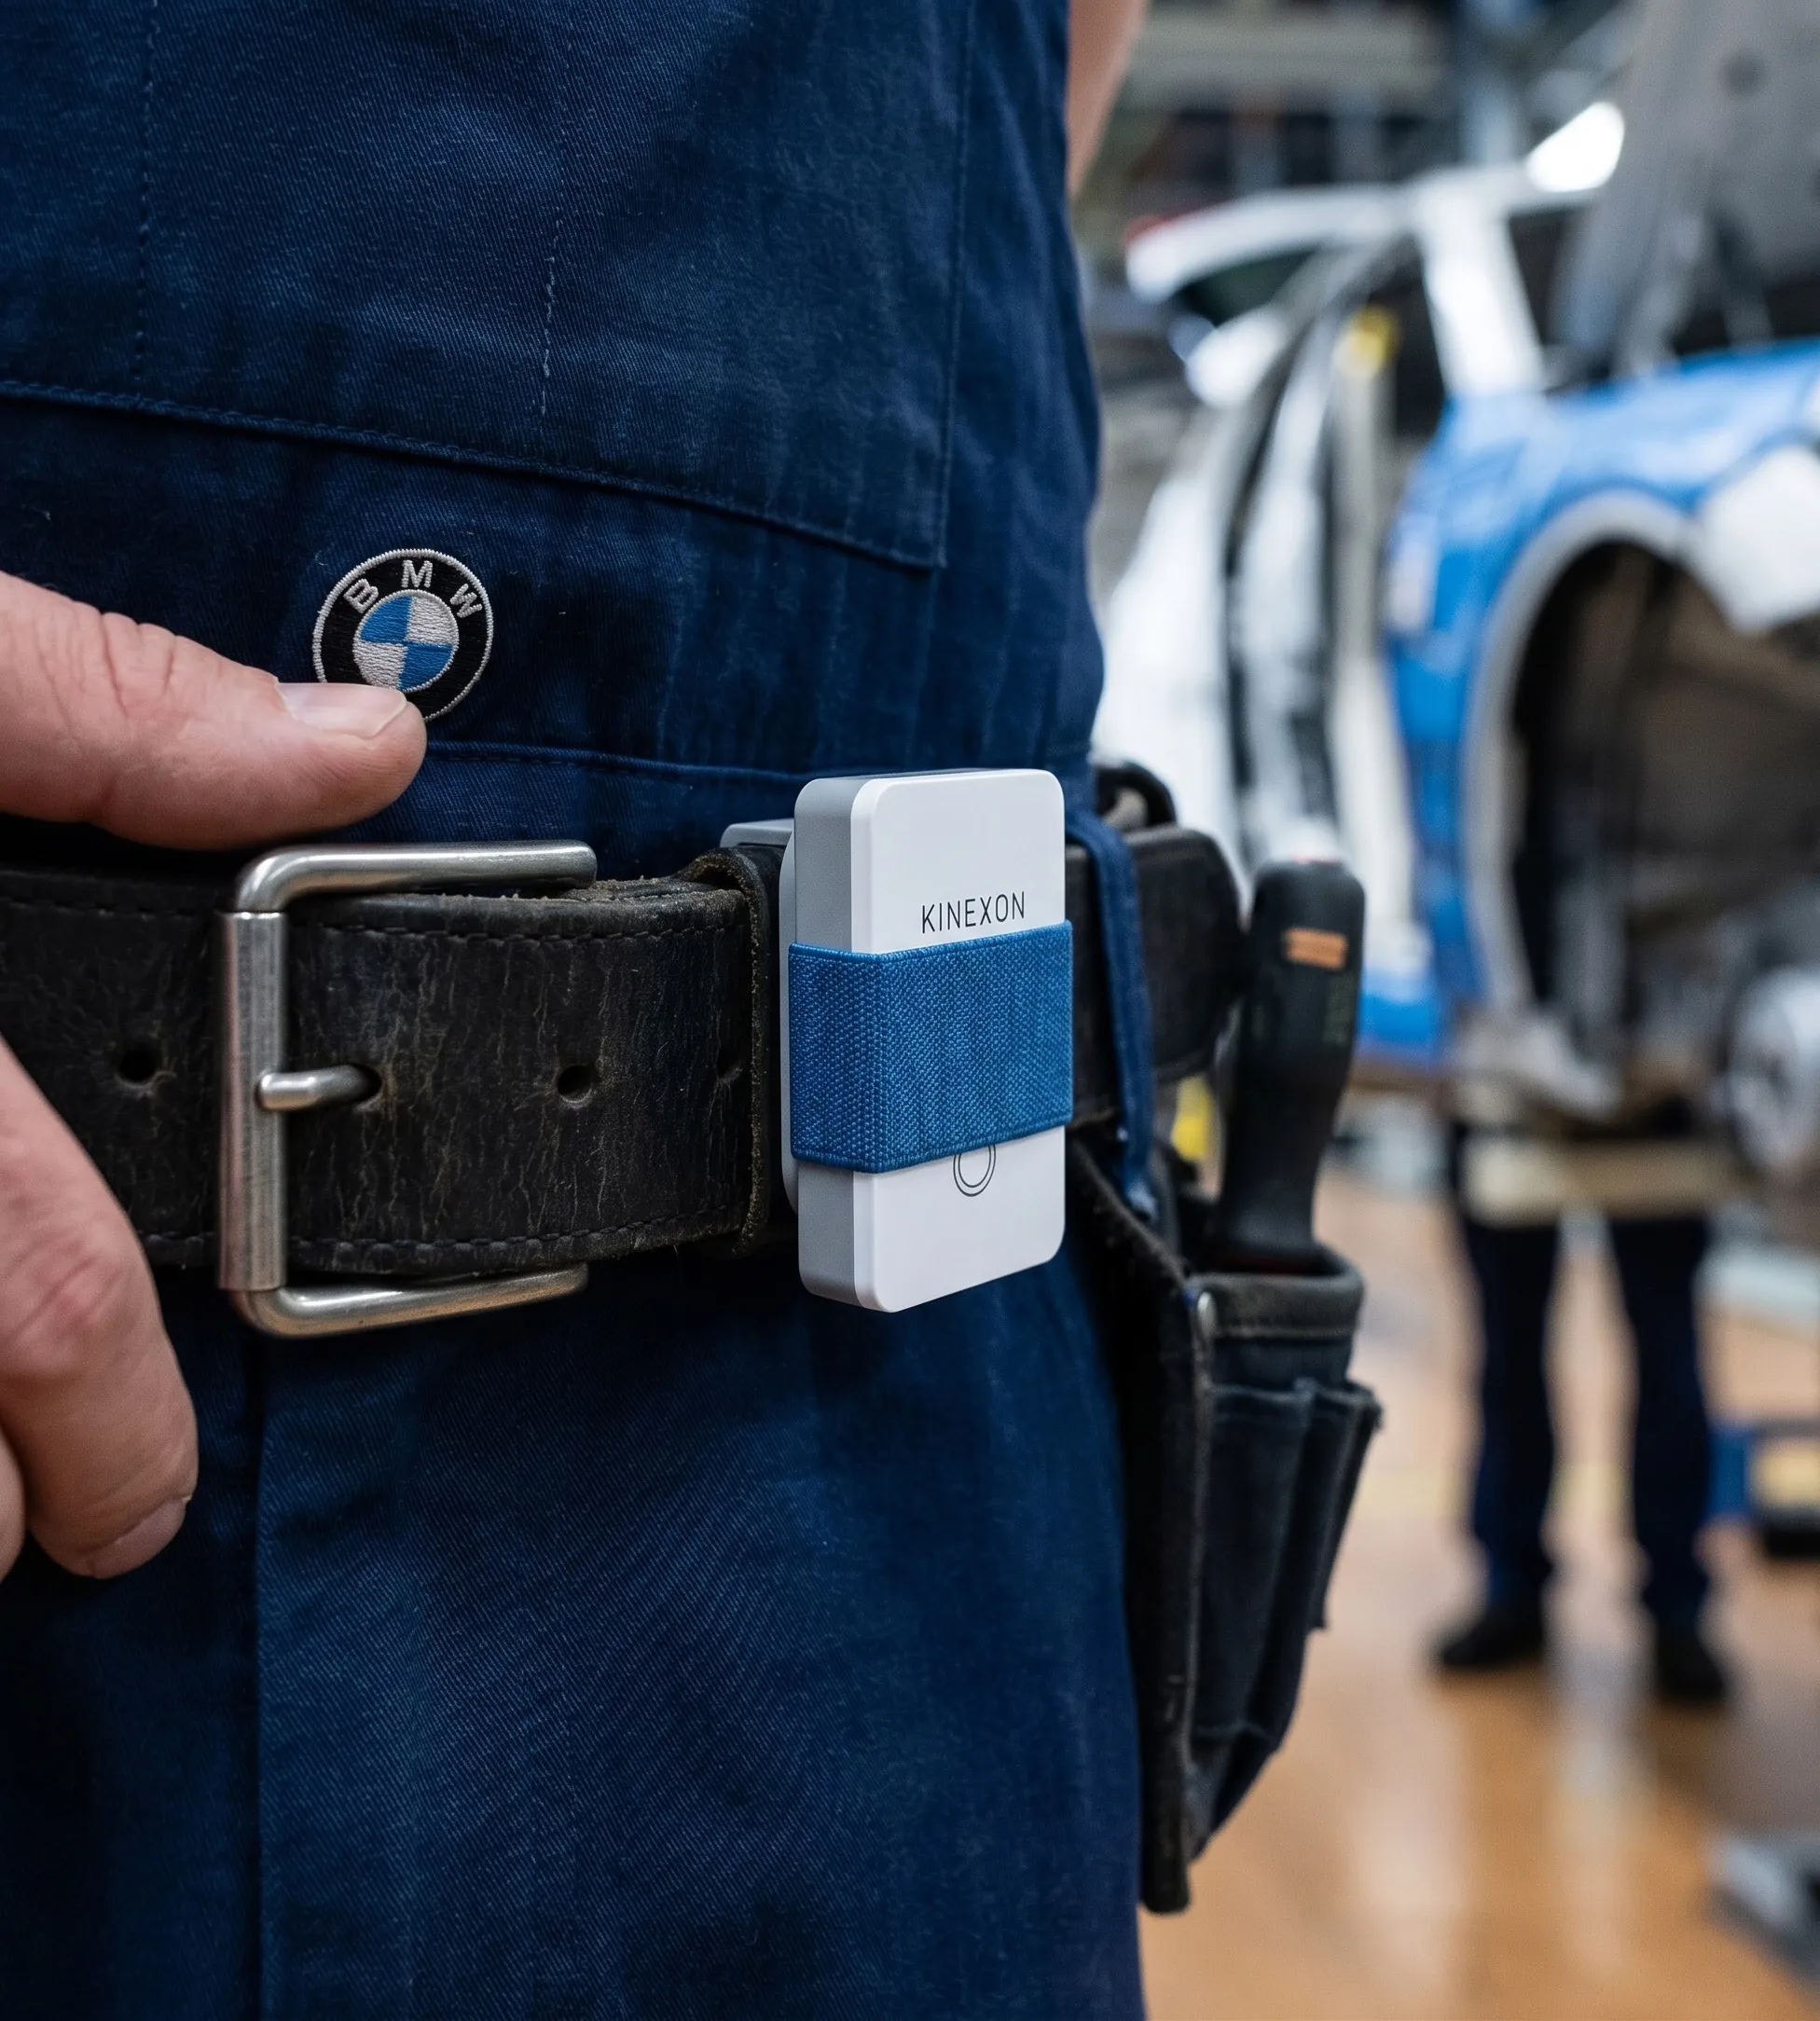
A safety sensor that hung like a forgotten ID badge.
Design cooperation with BMW, module TD5, THD, Winter 2023/24 · 3 months
Ansys proposes a shape, then gives up.
Simulation, Munich University of Applied Sciences, Summer 2026 · 3 months
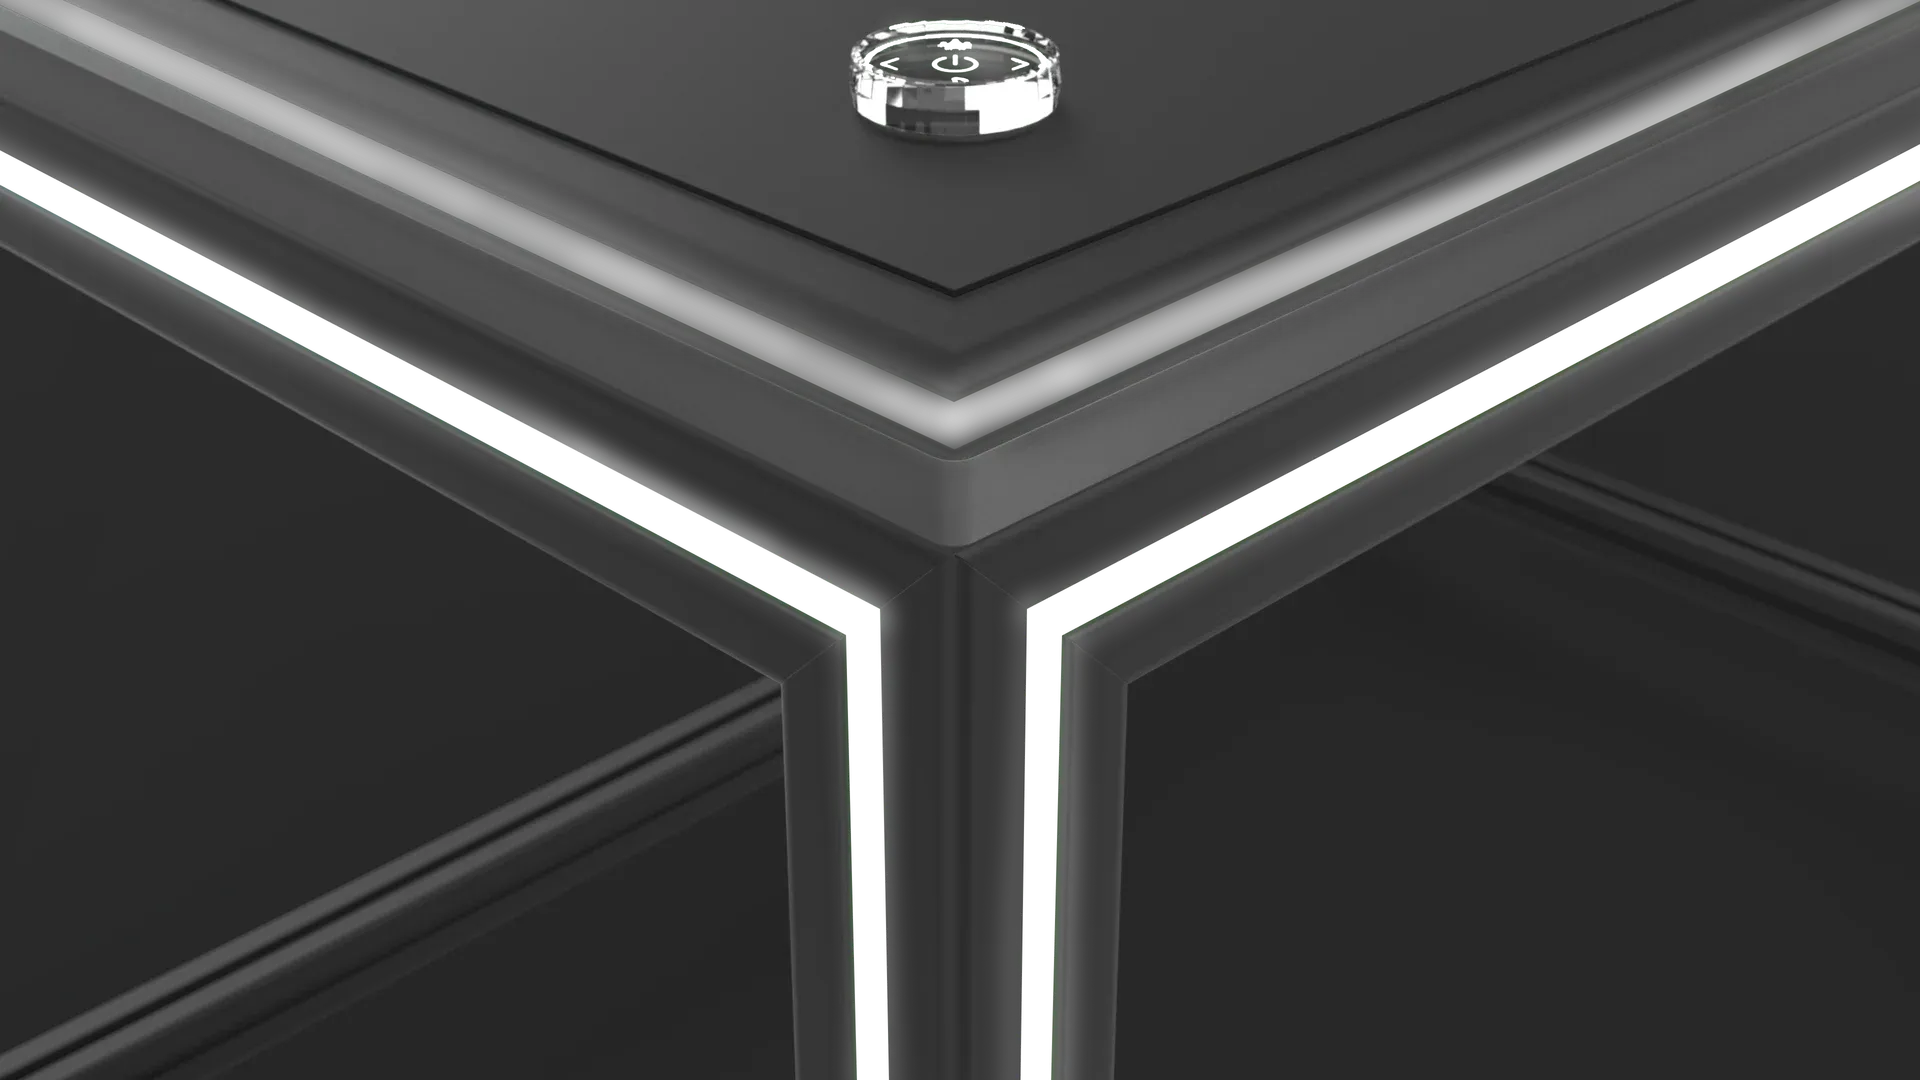
A new plant needs furniture for the shift briefing.
Cooperation project with BMW, Summer 2023 · 3 months

One curve does the handle, the rim and the stacking.
Semester project, Summer 2022 · 3 months
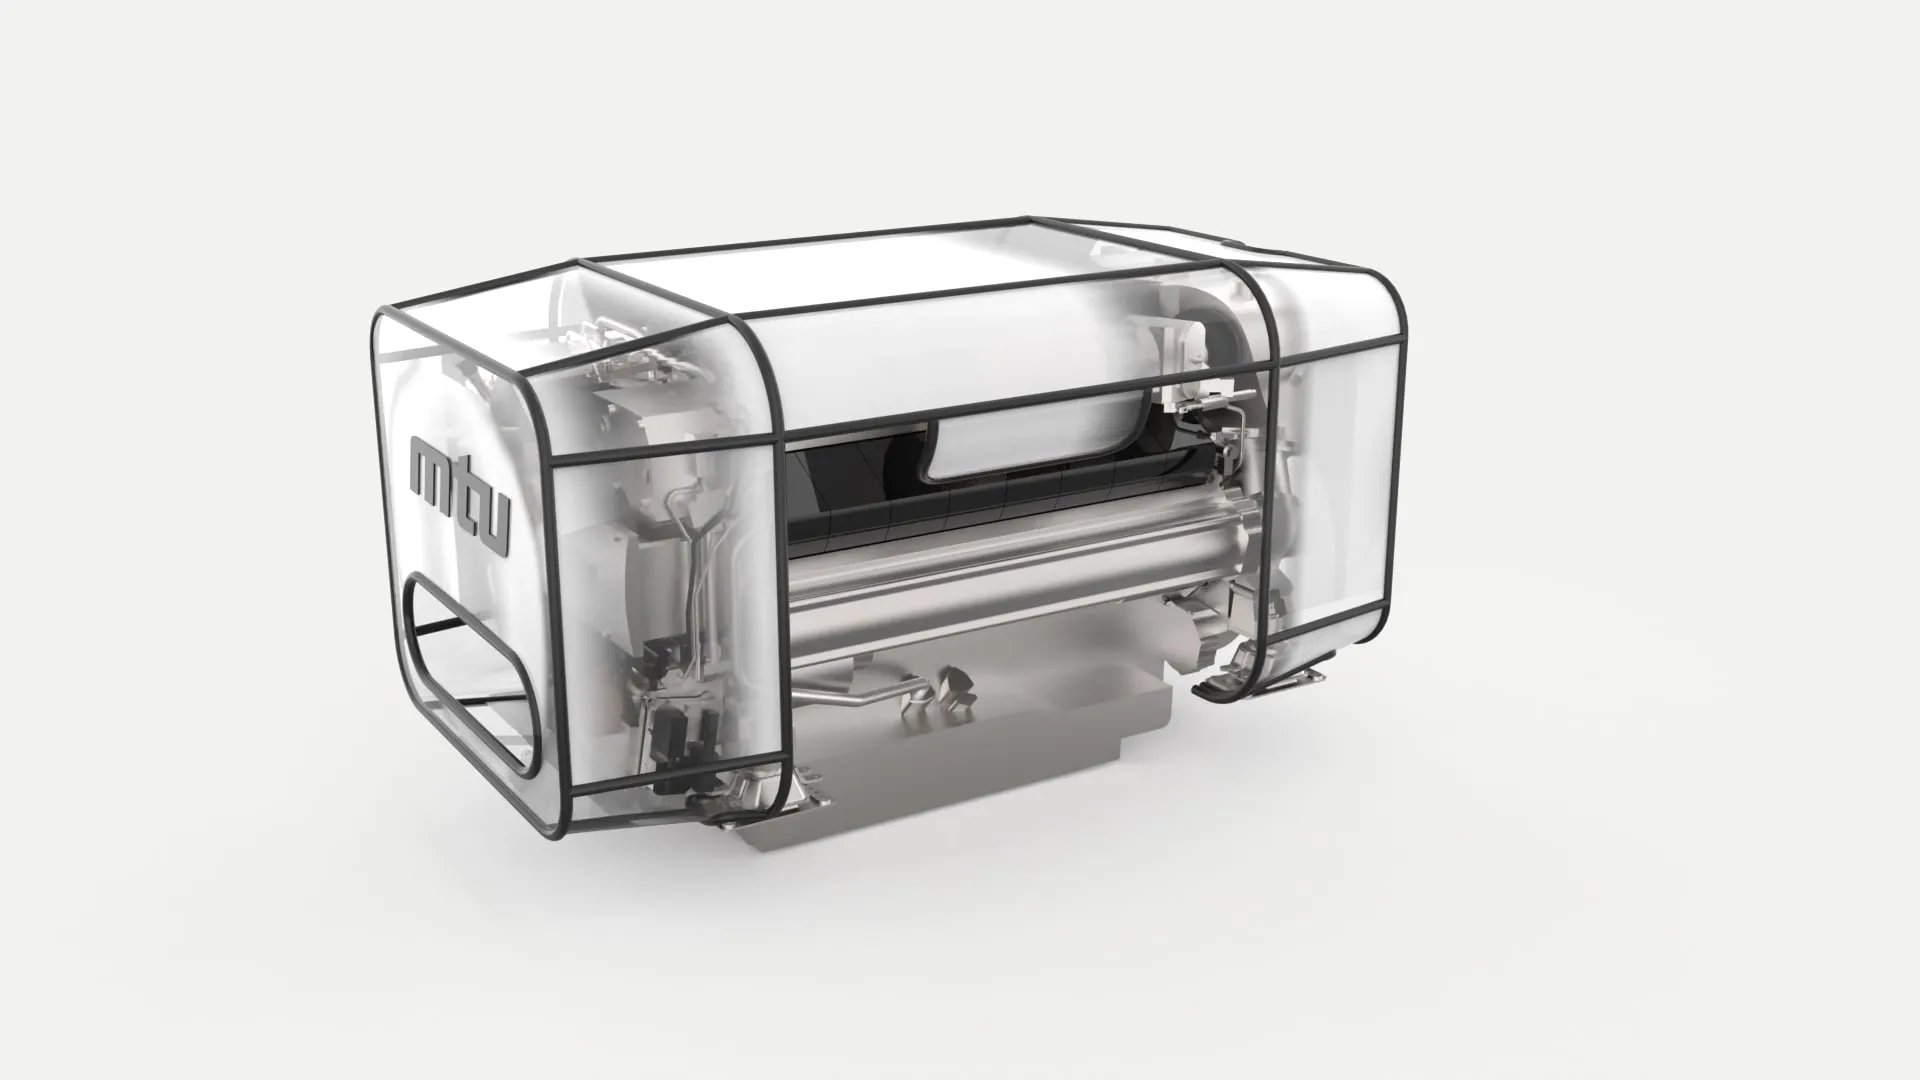
An industrial engine looks like what it is: a machine.
Collaboration with mtu / Rolls-Royce Power Systems, Winter 2022/23 · 3 months
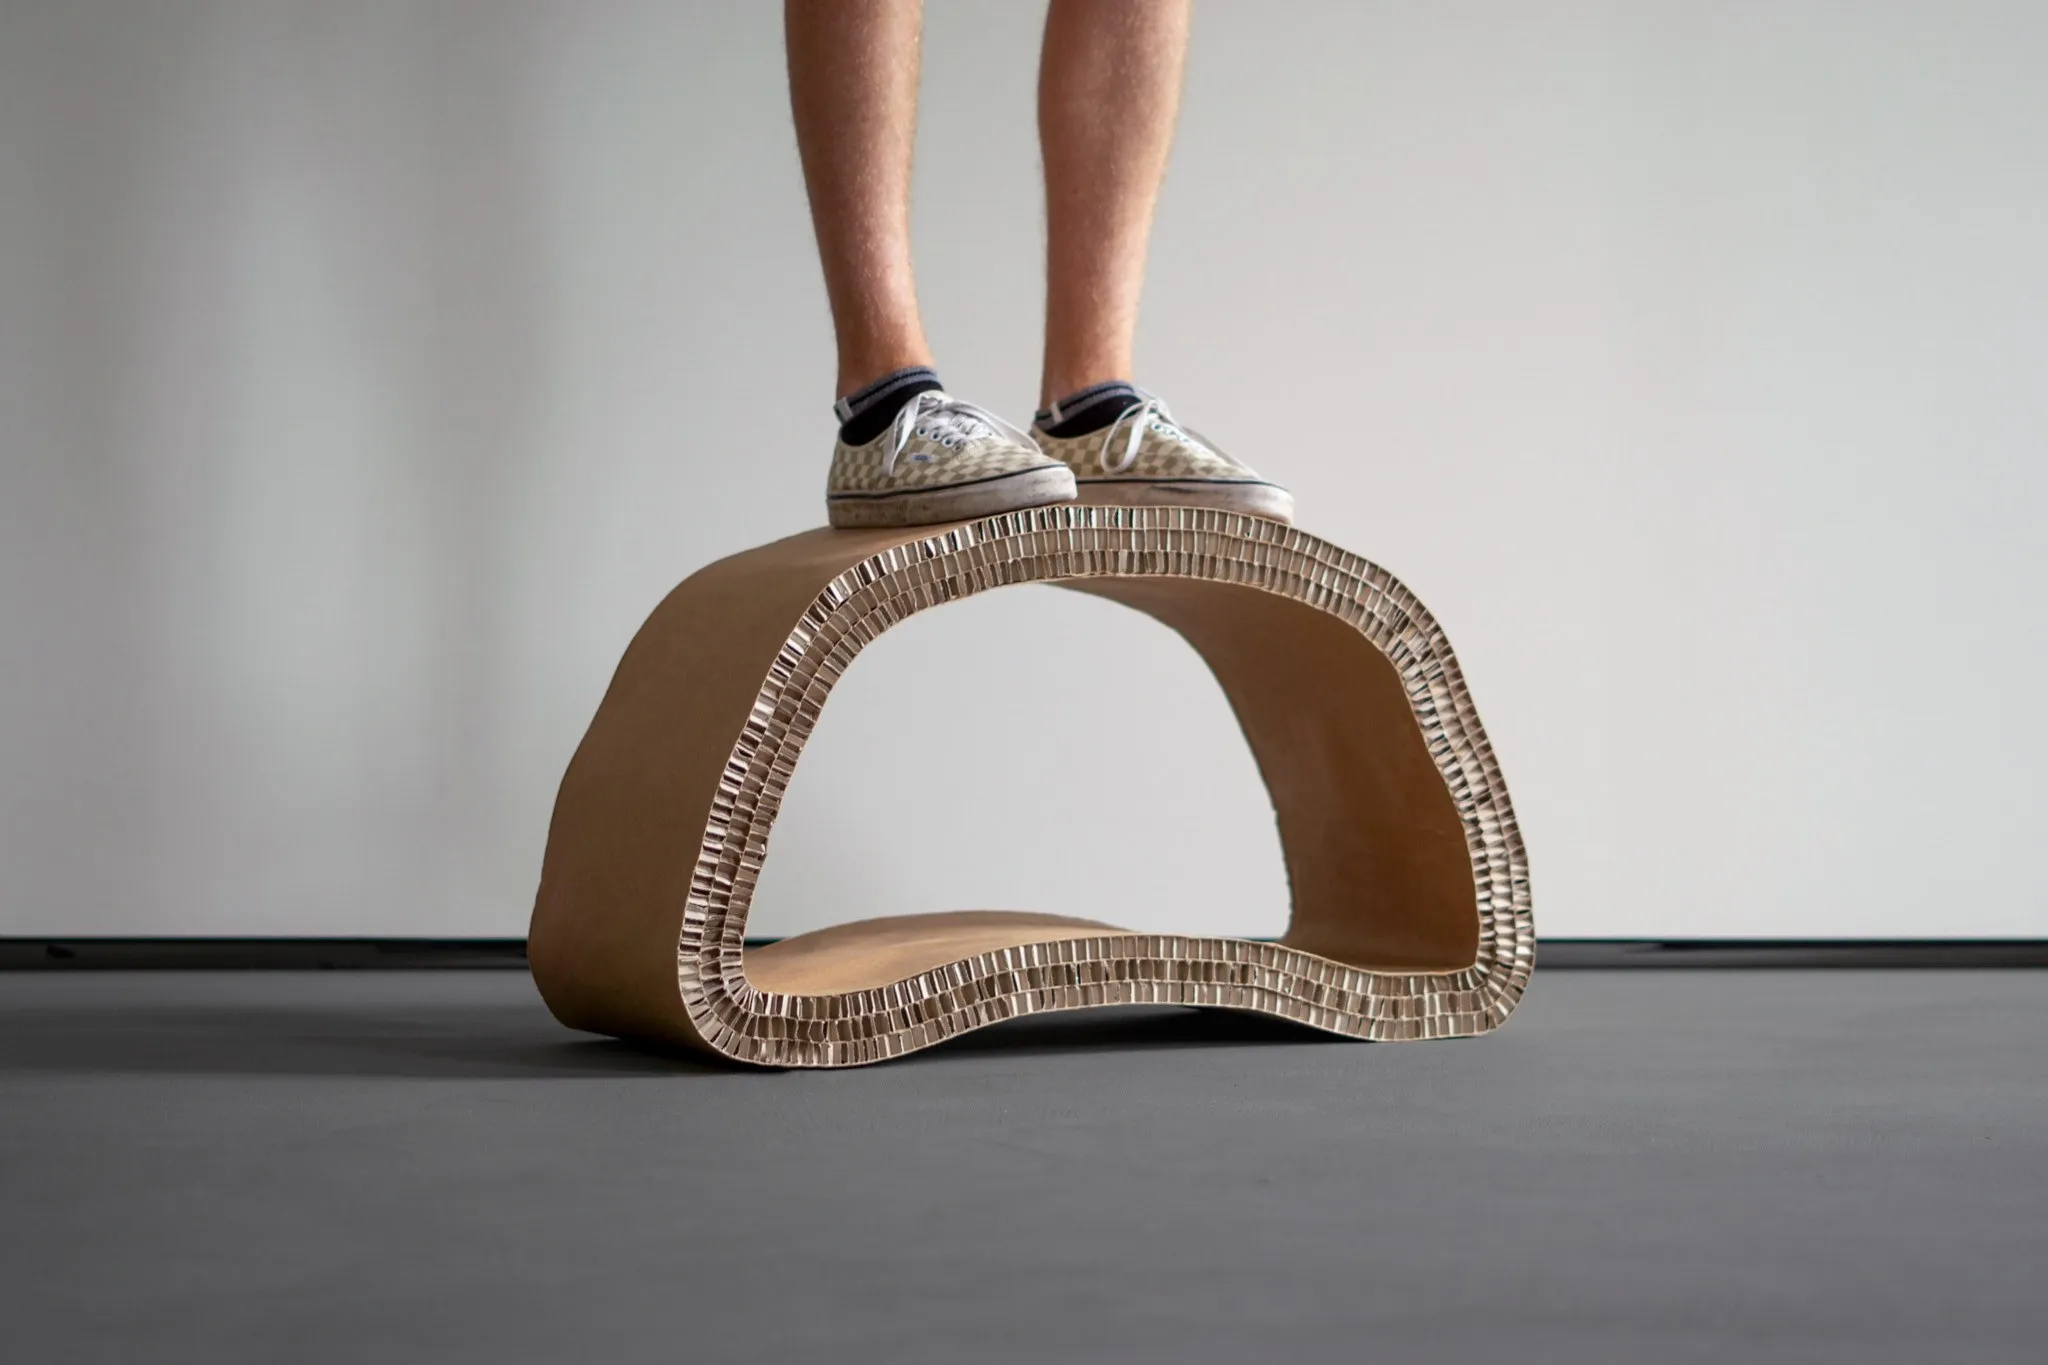
Open, the board bends in your hands.
Semester project with a packaging manufacturer, Summer 2023 · 3 months
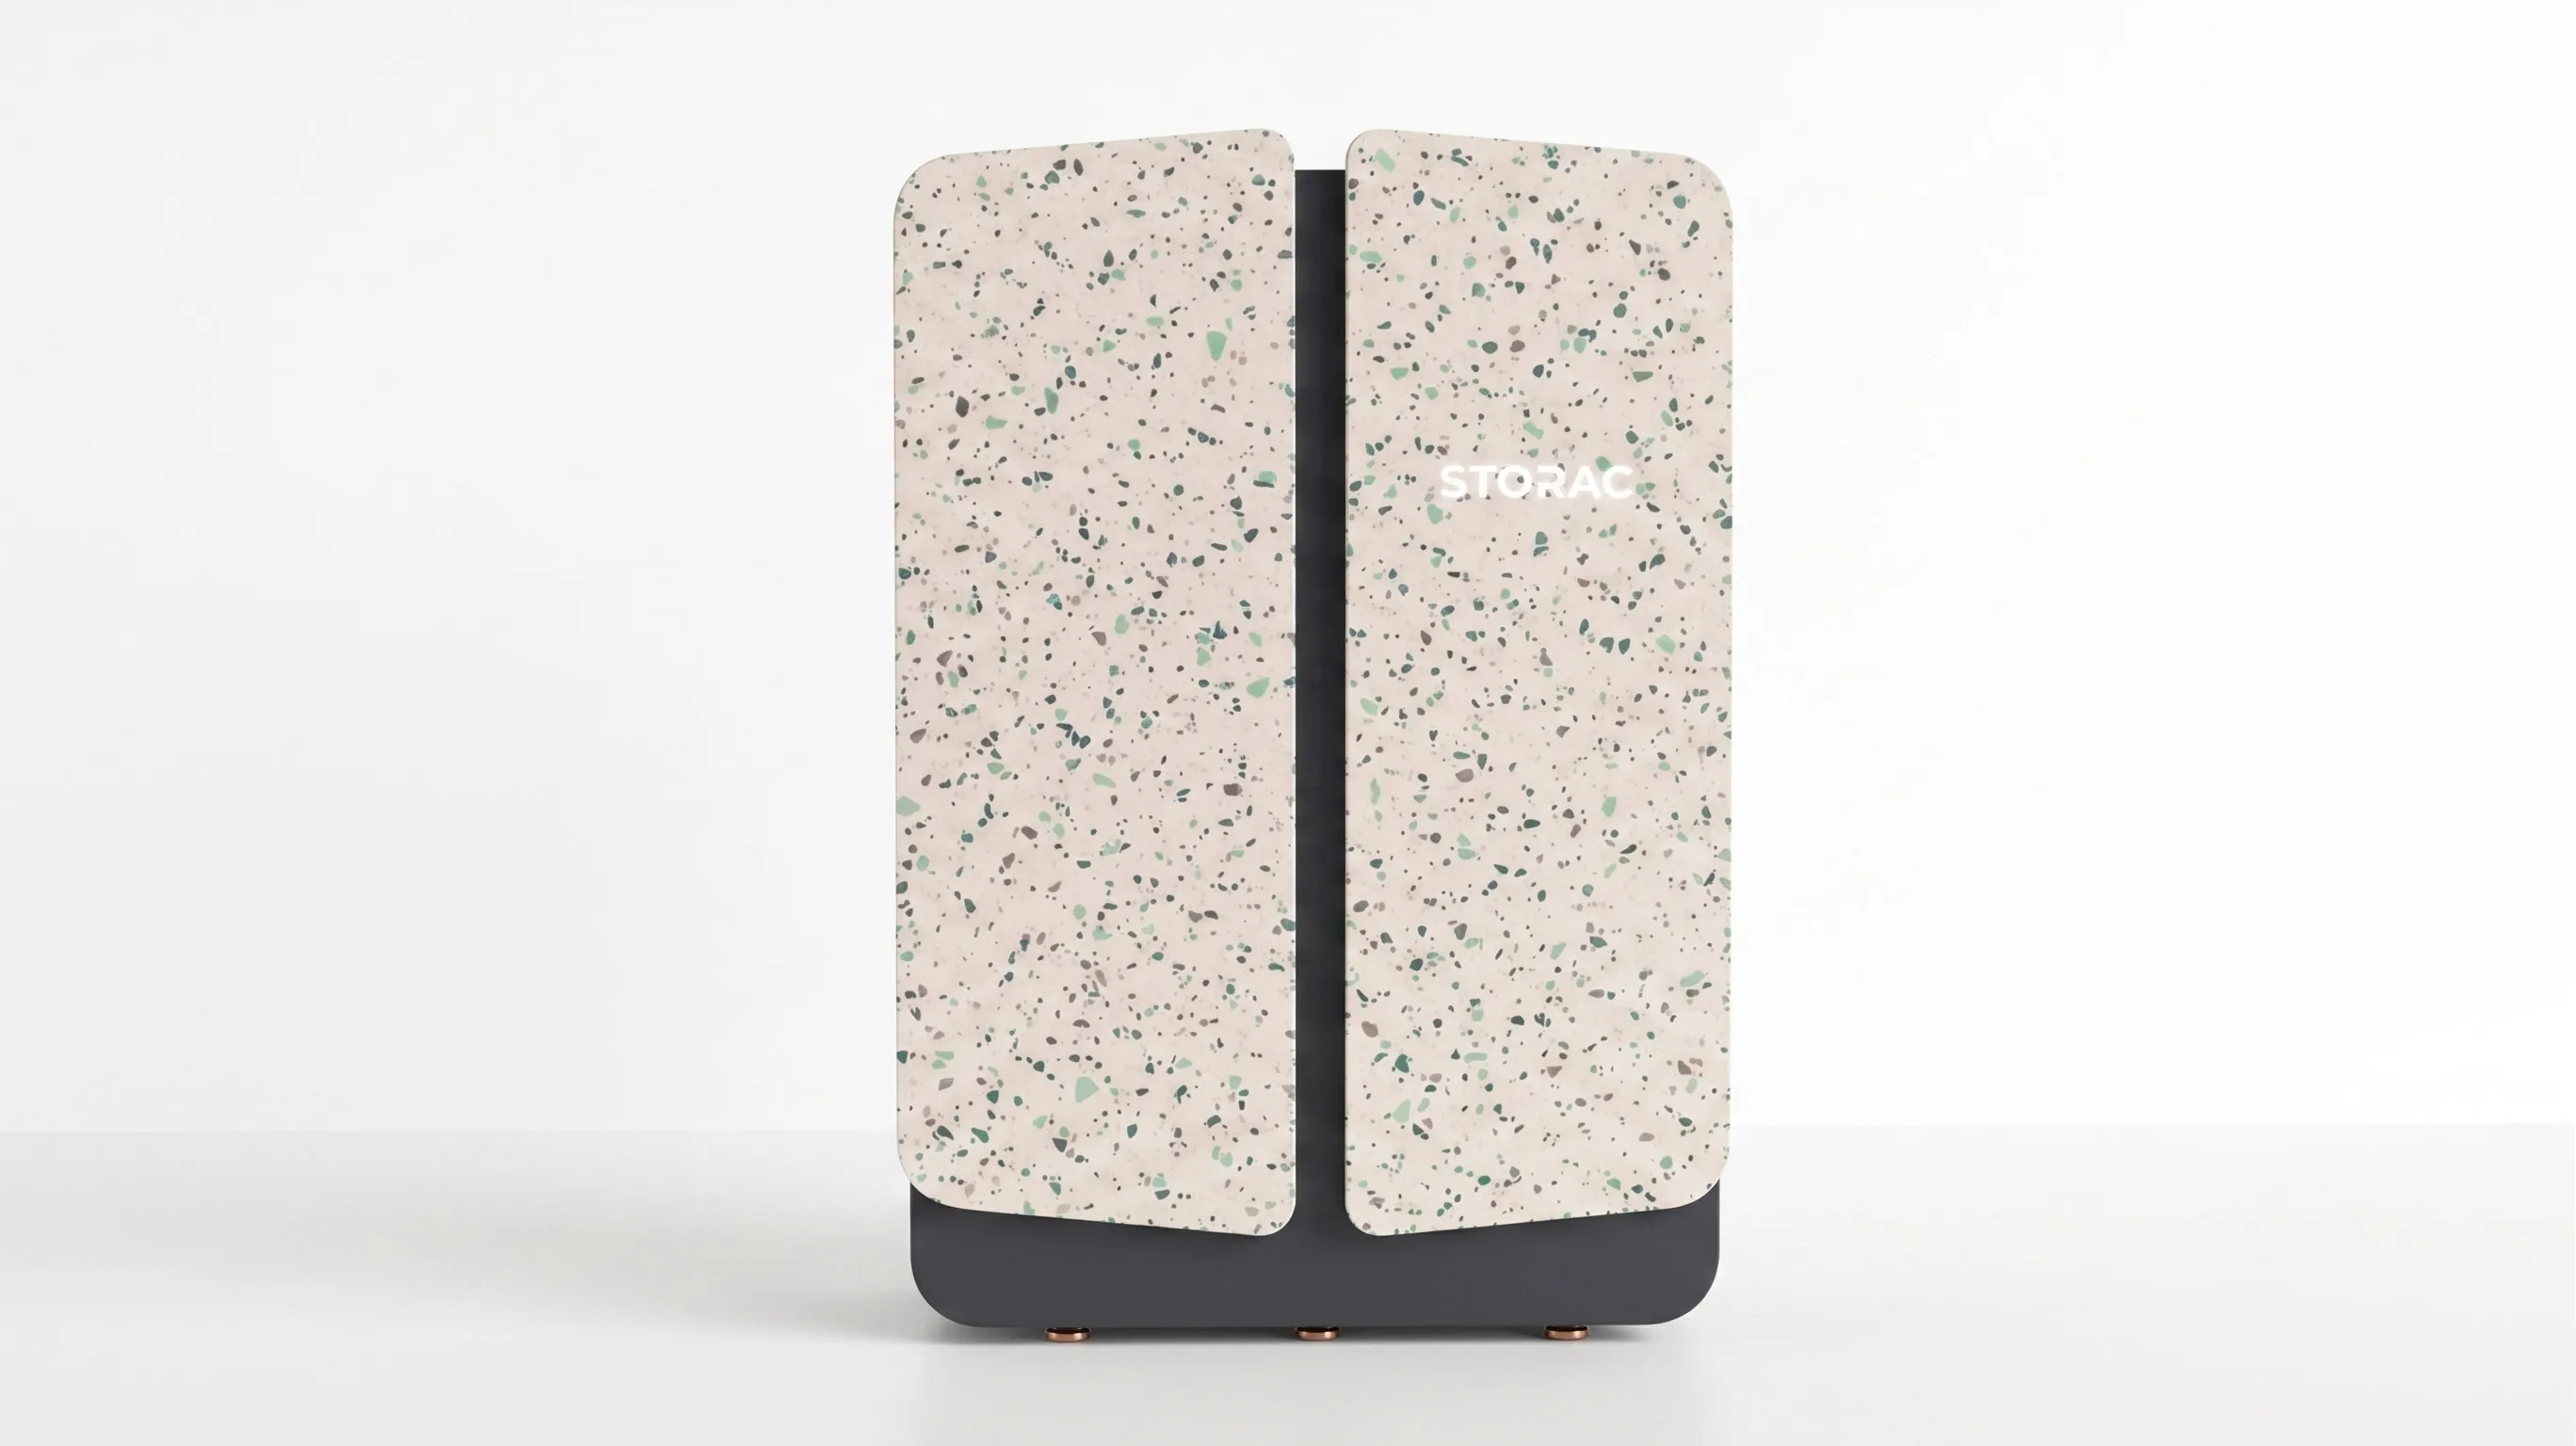
A home battery that looked like a switch cabinet.
Design cooperation with Prolux Solutions, THD, Mar–Jul 2023 · roughly 3.5 months
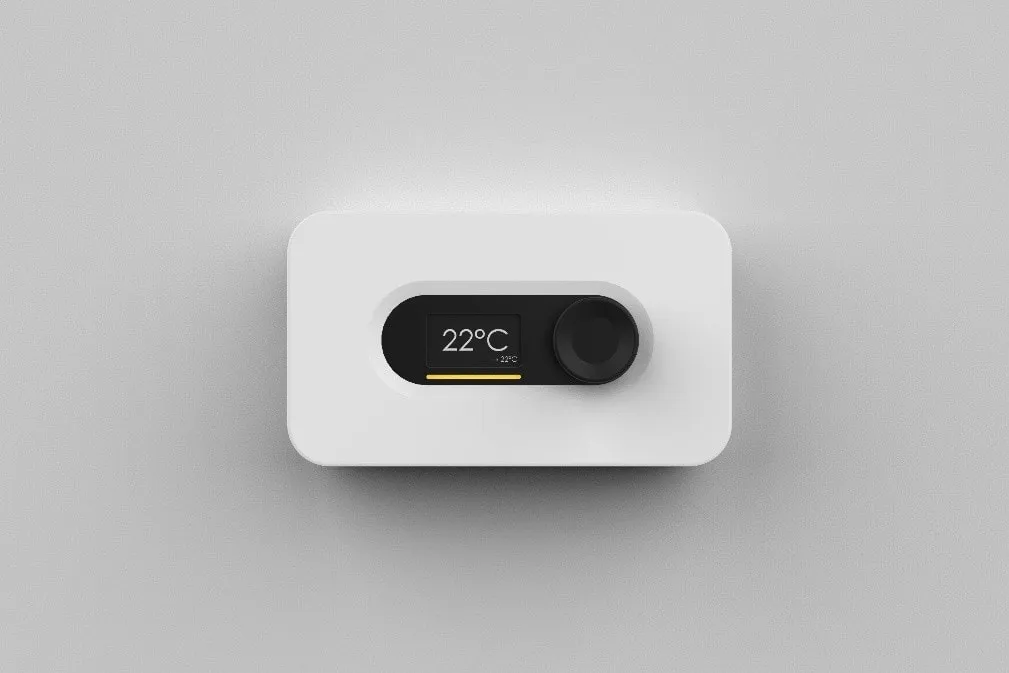
The university had the electronics and no enclosure.
Commissioned work for the university, Winter 2024/25 · 3 months
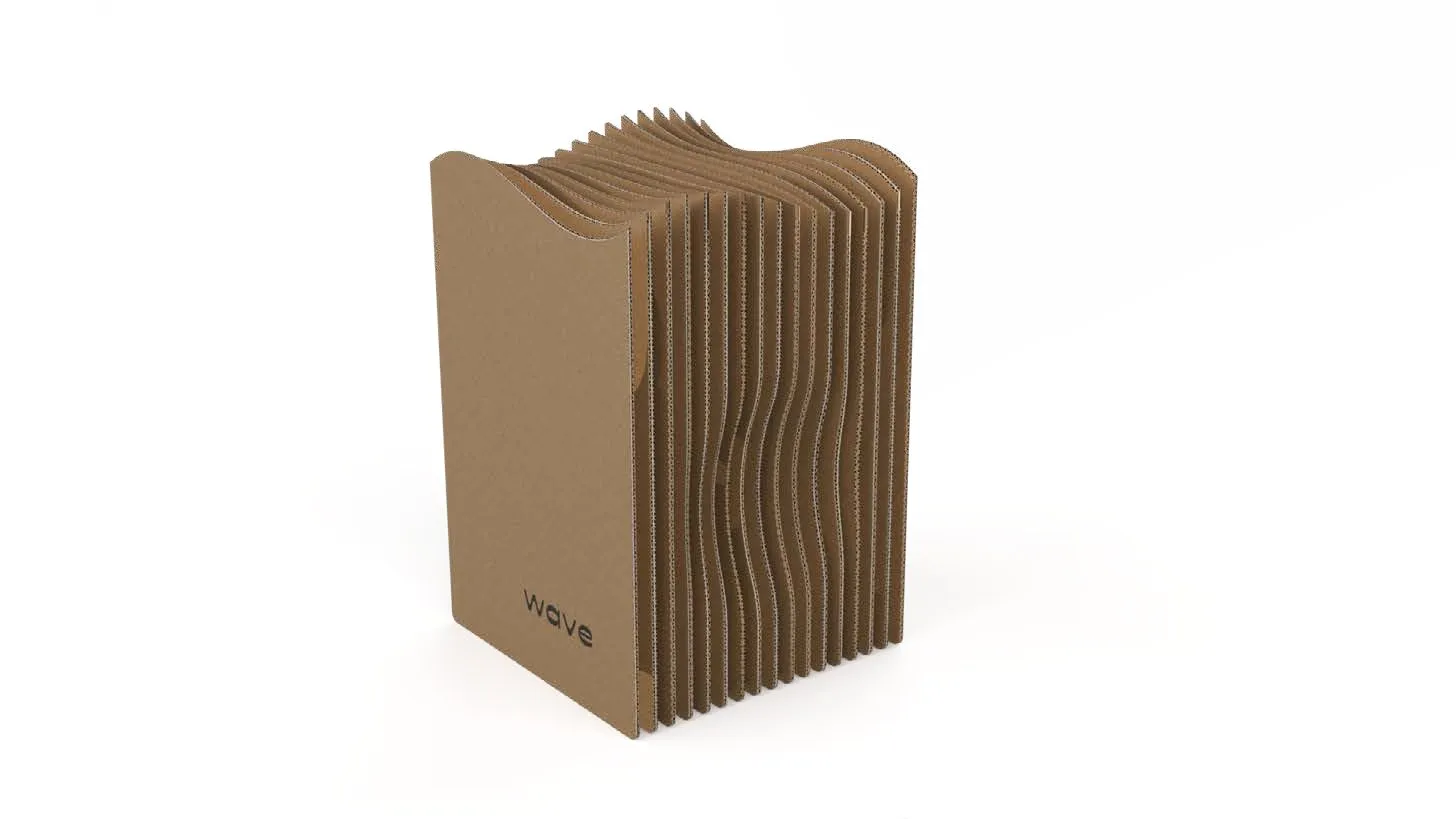
A cardboard box that makes a speaker louder without adding a single watt.
Material workshop, THD, 29 Apr – 7 May 2023 · one week